Editors Note: WordPress does not do a great job of formatting for mathematical examples. I have created a downloadable PDF if you would prefer.
This is an oversimplified example. The purpose is to get you comfortable with the “Math” (see Appendix 1) and to demonstrate the effect of Uncle Fed’s Taxes on your friend IRA.
I will go through the numbers for the first year here manually.
The setup for both is as follows:
Step 1: Get your assumptions in order
Here’s the presumed budget.
- You have $25K in fixed expenses, $100K in total expenses
- You get $25K in social security (so your Fixed Income Ratio is 100%).
- Both your Total expenses and Fixed Income grow at 3% per year inflation
Note: These examples assume that your Fixed Expenses and Fixed Income exactly match each other. The $75,000 that you need will be coming from your IRA.
Here is your Savings
- You have $100,000 in your savings account.
- You will take the distributions from your Invested Assets of $1.5M.
- Example 1 Assumes that you had all of this in Non-Qualified Assets (i.e., no IRA). You’ve already paid your taxes on the amounts that you put away, and therefore only pay tax on interest earned.
- Example 2 assumes that you have all of your invested assets in Qualified/IRA money. You’ve not paid any taxes to date on these accounts. Therefore, both your distributions and any interest earned on that distribution after it is taken are taxable.
- You’ll take the withdrawals at the end of the year. This could be changed easily enough to beginning of year, middle of year or whatever, for those inclined to do so.
And here are the appropriate rates to use:
- Your Tax Rate is 25% per year.
- Based on the types of investments you have, you feel that you can earn a long-term rate of 8% (your “TargetRate”). For the example, your actual earnings are assumed to be 8%.
Step 2. Calculate your Income Ratios and Needs
| Example 1 | Example 2 | |
| Fixed Expense | $25,000 | 25,000 |
| Fixed Income | $25,000 | 25,000 |
| Fixed Income Needs (diff) | $0 | 0 |
| Total Expenses | $100,000 | 100,000 |
| Total Income | $25,000 | 25,000 |
| Total Income Need After Tax (diff) | $75,000 | 75,000 |
| Total Inc Need Before Tax = Inc After Tax / (1-Tax Rate if Qualified) | $75,000 / (1-0%) = $75,000 | 75,000 / (1-25%) = 100,000 |
Comment:
- This shows the “additional tax” that you pay to redeem your IRA. During your working lifetime, you should plan on saving not only for the expenses that you have, but for the taxes you will owe.
- Your tax bracket when you retire will depend on your “Standard of Living” (expenses) and what portions of that are funded from Pre- or After-tax money. I did not assume a difference in the examples.
Step 3. What are your Minimum Assets and Minimum Earnings rate
From the writeup, you’ll note that you are in “Case 2” – You have your fixed income needs met, but have to cover your Total Expenses. So, we will only calculate amounts using your “Total Income Needed”
| Example 1 | Example 2 | |
| Total WD Needed (above) | $75,000 | 100,000 |
| After Tax Target Rate | 8% x (1-25%) = 6% | 6% |
| Min Assets Needed | $75,000 / 6% = $1,250,000 | 100,000 / 6% = 1,666,667 |
| Total Income Needed (above) | $75,000 | 100,000 |
| Invested Assets x (1-FIT) | $1,500,000 x (1-25%) = 1,125,000 | 1,500,000 x (1-25%) = 1,125,000 |
| Min Earnings Rate before Tax (divide) | $75,000 / 1.125M = 6.67% | 100,000 / 1.125 = 8.88% |
Comments:
- This isn’t necessarily fair. If you put all of your money into non-taxable assets (Example 1), then you’ve historically paid more than when you saved them in a qualified/IRA/401(k) type account.
- The fact that these examples both assume $1.5M in invested assets therefore means that you have effectively saved more over time in Example 1 than in Example 2.
- In Example 1 – you’re doing ok – a 6.67% rate is less than your 8% target. This is Case 2A.
- In Example 2: – you’re past the point of “no return” and have to adjust. BUT… the amounts are not unreasonable and can be done. Changing your investments (taking more risk) to get to 8.88% is not a big hurdle. Or, you can remove about $25,000 from your budget every year. Or, some combination of the two. Try seeing what expenses you can cut, and then if not $25K, simply go and redo the calcs for the Minimum Assets and Rate.
Step 4. How much risk can you take?
| Example 1 | Example 2 | |
| Total Savings | $1,600,000 | 1,600,000 |
| Minimum Assets Needed | $1,250,000 | 1,666,667 |
| Nest Egg = Difference | $350,000 | -66,667 |
| Target Rate to Earn | 8.00% | 8.00% |
| Minimum Rate Needed | 6.67% | 8.88% |
| Risk Tolerance | 1.33% | -0.88% |
Comments for Example 1:
- At the time you start, you have about $350,000 in money saved up to spend over your lifetime.
- Part of this money is earning interest and growing your funds over time, which is good to offset increased expenses and inflation.
- Part of it can also go towards other things – buying that ostrich farm!
- Figuring this out really requires you to project out further, and monitoring how well you are doing against what you calculated here.
Comments for Example 2:
- As noted above, you’re already in past the point of no return – literally -0.88%!
- But as described above, you can work to change this. And, if you have a good year (say 10%), that helps offset some of this, so keep monitoring!
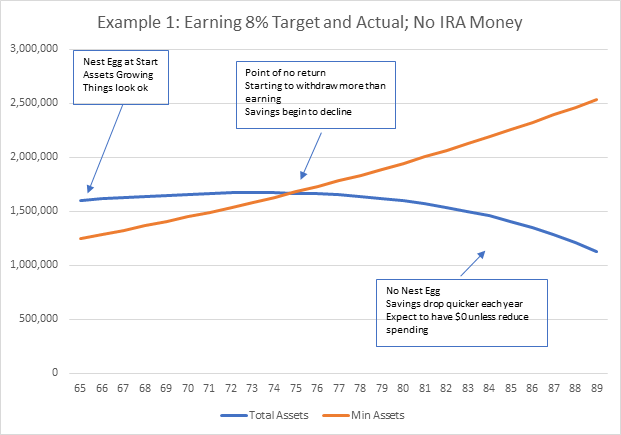
Step 5: Projecting Forward

Comments
- The first year looks ok. But what happened here?
- Inflation happened. Even if you are earning 8% and inflation is 3%, you still have to cover the difference
- Your 8% earnings are really only 6% after taxes.
- These are applied to you (Assets – Prior Withdrawals) – a declining number
- But 3%inflation is applied to your total expenses – a growing number.
- By about age 74, you are now at the “Point of no return” – that is, the amounts you earn on your assets cannot keep up with the growth in your expenses.
- The longer you live, the steeper that decline is (the blue line). At some point it becomes unreasonable.
Some sample ages
| Age 66 (1 year) | Age 72 (6 years) | Age 88 (24 years) | |
| Expenses | $77,500 | 122,987 | 197,359 |
| Income | $25,750 | 30,747 | 49,340 |
| Income Needed | $77,250 | 92,241 | 148,019 |
| Invested Assets | $1,510,500 | 1,537,342 | 837,292 |
| Min Earning Rate | 6.67% | 8.04% | 23.57% |
| Min Assets | $1,287,599 | 1,529,991 | 2,466,983 |
Age 65:
- Your fixed income grew $750 (Social Security only)
- Your expenses grew by $2,550 (77,500 – 75,000)
- So, your assets have to make up the difference of $2,250. That means that the amount you needed went up by approximately 2250 / 6% = $37,500 to cover the difference.
- BUT… your actual assets went up by only $10,500.
Age 73: This is the point of no return
- Your expenses grew by almost $50,000 due to 3% inflation.
- Your assets have stayed about the same – about $1.5M
- It stands to reason that the earnings will not be keeping up any more. Your assets will begin to decline.
- It does not mean that you will run out of money during your lifetime. That said, the rate of decline will increase year over year. A projection is useful here to understand how long your money will last.
Year 24 (age 88)
- If the projection held out, you’re now spending almost $200K to live on , and with only $50,000 in income you’re expecting to take almost $150K per year from your savings.
- But you’ve spent down assets to $840K. So, you would need to earn 24%/year, which is not reasonable.
- You would have to cut expenses somewhere. Sorry, ostrich farm gets sold.
Comment – DO NOT PANIC. I projected things over a 25 year period. Heck, that’s not reasonable – things will change. Nothing works as projected, even over a single year. The purpose here is to keep tabs on it to make sure you don’t end up in a bad place.

Comments:
- At age 65, you already knew that your assets were past the point of no return.
- If you do nothing, and if everything went as planned, then by age 84 you have exhausted your IRA.
- The example assumed that you were able to keep $100K in your savings, but that will be disappearing after age 84. I did not try to adjust for that here.

Leave a comment